Category: Uncategorized

Affordable Rental Housing: Who Gets it? What is it?

Guest Article: Benjamin Lockwood, President & CEO of Housing Visions

There is talk everywhere about the need for more affordable housing at the local, state, and federal level.  There is clearly a need, but what is affordable housing?  If I ask five different people to define affordable rental housing, I will get five different answers – none of which are incorrect. There is an array of affordable housing programs for rental housing.  The most visible are the Section 8 Voucher Program, Public Housing, and the Low Income Housing Tax Credit (LIHTC) developments, which have significant overlap and additional supplemental Federal and State funding.

To better understand and demystify affordable rental housing I will get to some basic definitions.  Eligibility for affordable housing is defined by families earning 80% or less of the Area Median Income (AMI) by geographic location.  AMI is defined by geography on an annual basis by the Federal Department of Housing and Urban Development (HUD).  For the Syracuse Metropolitan Statistical Area (MSA), the 2023 AMI for a family of four is $93,300.  This figure is the point at which 50% of similar sized households earn more and 50% of households earn less.  The AMI increases or decreases based on household size as well as geographic location.   In the Syracuse MSA, a family meets the criteria for affordable housing programs if they earn $74,650 or less, which, is 80% of AMI.  Affordable housing eligibility covers everything in between $0-$74,650 for a family of four in Syracuse. That is a very wide spectrum! Going forward, I will use figures that only contemplate our theoretical family of four.

Let us examine how affordable housing works in our most visible housing programs from above: the Section 8 Voucher Program, Public Housing, and the Low Income Housing Tax Credit. If the family earns 80% or less of AMI, they are eligible to receive a Section 8 Voucher and/or have eligibility for public housing. However, both are in high demand and a family may wait 5-10 years to receive the voucher or secure a public housing unit.  A Section 8 Voucher allows a family to usually pay 30% of their income towards rent and utilities and the subsidy from the government pays the remainder.  The Section 8 Voucher is flexible and can be utilized by a family with no income all the way up to the limit of $74,650. Section 8 is a good deal for landlords because they are typically guaranteed at least 70% of their rent. If family income exceeds the 80% AMI threshold, they no longer receive the benefits of Section 8. Locally, the Syracuse Housing Authority will pay a contract rent (determined by a variety of factors established by HUD) to a landlord of a 3-bedroom apartment at a rate of approximately $1,325 per month.  If the rent is greater than $1,325 per month, the tenant has to cover the difference, which will then make their housing costs greater than 30% of their income.

Similar to the Section 8 Voucher Program, in Public Housing, households pay approximately 30% of their income towards rent and utilities.  If the family income increases, so does the rent.  Once a family moves into public housing, they may remain there as long as they are tenants in good standing regardless of their income, which is a safety blanket for residents.  When residents surpass the 80% AMI threshold, the public housing agency may charge a market rent with no subsidy.

The last housing program, the Low Income Housing Tax Credit (LIHTC), was created in 1986 from the Reagan tax reforms.  LIHTC is housed federally in the IRS and administered at the state level by housing finance agencies and not HUD.  Succinctly, LIHTC is a public private partnership that provides private and not-for-profit developers tax credits in exchange for developing, building, and maintaining affordable rental housing.  Unlike Section 8 and public housing, LIHTC typically caps initial eligibility at 60% AMI, which equates to $55,980 for a family of four in Syracuse. In addition, most LIHTC developments have units that serve AMIs that range between 30%-60% AMI, and potentially even some middle-income (90% AMI) or market units (known as a mixed-income community).  In Syracuse for the family of four, a 30% AMI is $28,000 and a 50% AMI is $46,650.  The rent is set based on income tiers.  For example, three identical 3-bedroom units in a given development may have three different rent levels as illustrated below.

Unit Size AMI% Target Rent Income Required to Afford
3BR 30% $502 $20,080
3BR 50% $850 $41,080
3BR 60% $1,050 $49,080


All of these rents, especially at 30% & 50% AMI, are significantly below market rate apartment costs locally for a 3-bedroom apartment and almost always of higher quality because of funding program inspection protocol and requirements to maintain physical conditions.  Like public housing, once a family moves into LIHTC housing, they may remain (with an exception being households composed of all full-time students with no qualifying exemption), but their rent will increase to match what the family can afford.

According to census data and information on CNY Vitals, nearly 40,000 residents in Syracuse live below the poverty line.  Recent census data suggests that 51% of residents of the city of Syracuse pay more than 30% of their income on housing with 31% paying more than half of their income!  There is no silver bullet to solving the affordable housing crisis, but one thing is clear:  We need MORE quality housing, everywhere.  Poverty is not a Syracuse problem alone; it is in every corner of our community – urban, suburban and rural.  In the past year, while County Executive Ryan McMahon touts the coming of Micron, he quickly follows up with the need for communities to build more housing units of all types from market rate to affordable and from family to senior.

Addressing affordable housing is admittedly more complex than anyone wishes, but I hope your takeaway is that it is applicable to a wide swath of our local population. Before you read this article, would you believe that a family earning nearly $75,000 is eligible for affordable housing programs?  We need to serve all incomes to ensure individuals and families have safe, decent, affordable housing in their community of choice.

Share

Understanding how scarcity, poverty, health outcomes, and equality relate, and what we can do to improve them in Central New York

Guest Article: Jared Duggal, senior, Fayetteville Manlius High School
View Findings of Jared’s Research Project

Poverty is pervasive in America’s cities, and this is particularly true in Central New York. While our biggest cities’ challenges are often in the national spotlight, America’s small and midsize cities are home to more people, and their health disparities receive far less attention.

These health disparities are often driven by social determinants, those non-medical factors like income inequality, rent burden, and poverty that can influence health.

It is well established that higher poverty levels are associated with lower life expectancy, but several aspects of this relationship and the association of social determinants remain unclear. Although we know countries with a high poverty level have a lower life expectancy, the relationship is less clear when we look at the extent that gaps in life expectancy vary at the local city level. In addition, there is still debate on the importance of factors such as inequality, economic and social stress and how they relate.

With these questions unanswered, a research study was undertaken to evaluate how scarcity, poverty, health outcomes and equality relate and to determine what we can do in Central New York to improve them.

Data from publicly available databases including the US Census Bureau were utilized to create datasets of city poverty rates, life expectancy and 16 measured social determinants including number of households with a broadband connection, population that has completed high school, income inequality index, housing with potential lead risk, limited access to healthy foods and neighborhood racial/ethnic segregation.

A matching algorithm was then created that compared small/mid-sized US cities with the 25 highest and the 25 lowest poverty rates in order to help city leaders understand how poverty and health disparities in their communities are driven by social factors and allow comparison with demographically similar cities to guide future policy interventions.

The results were surprising:

  • Life expectancy is statistically different depending on if you live in a US small to medium sized city that has high poverty compared to those that are in the low poverty group.
  • Comparison of social determinants between cities in the high and low poverty groups also demonstrated significant differences in almost all the measured variables.
  • Increased poverty rates were strongly correlated with increased smoking rates, excessive rent burden, credit insecurity, and neighborhood racial segregation.
  • Increased poverty rates were strongly correlated with decreased high school completion rate, household access to broadband connection, and the income inequality index score (the lower the index score the more unequal the income distribution)

The paired matching algorithm successfully paired similar cities from the high and low poverty groups, including for cities in Upstate New York. The matching algorithm will help city leaders leverage policy and program approaches targeting poverty that will also advance health.

Recent efforts by the City of Syracuse to offer free, high-speed and secure Internet service for hundreds of low-income residents is a step in the right direction to addressing one of the social determinants of poverty. Understanding that poverty is a national emergency with implications to the longevity and health of all Americans is crucial. When an approach to addressing the social determinants of health has proven successful in a city of the same population demographic type, solutions can be found to facilitate smarter investment strategies.

References

  • Braveman, P., Gottlieb, L., The Social Determinants of Health. Public Health Rep. 2014 Jan-Feb; 129: 19–31.
  • Department of Population Health, NYU Langone Health. City Health Dashboard.
  • United States Census Bureau.
  • Duggal, J. Utilizing large sociological data sets and the development of a novel matching algorithm to understand the relationship between poverty, social determinants and health outcomes in small to mid-sized US cities.
Share

New CNY Vitals Section Disaggregates Local Data by Race

The Central New York Community Foundation has added data related to racial inequities to its state-of-the-community website, CNY Vitals (cnyvitals.org). Data points related to civic participation, education, wealth accumulation, well-being, employment and income are disaggregated by race to advance an understanding of how different groups are differently situated in Central New York.

“There is something fundamental about being and feeling ‘seen,’” said Frank Ridzi, vice president of community investment at the Community Foundation. “Without an understanding of how and why local residents experience life differently across racial and ethnic populations, decisions on governmental policies, funding and institutional practices could be made that impact their well-being without the full picture.”

Using interactive visualizations, CNY Vitals tracks data points and monitors trends on issues related to the economy, housing, health, demographics, poverty and education in Onondaga, Madison, Cayuga, Cortland and Oswego counties. The statistics are pulled from a variety of sources including the US Census Bureau, US Department of Labor and New York State Education Department.

The Community Foundation states it would like to see the new measurements used to prompt discussions among community members, leaders and organizations. By informing residents, it hopes to help target resources and investments and monitor the impact of collective efforts – such as city-wide childhood lead poisoning prevention work – toward breaking down elements of structural racism that have led to the disparities presented.

“The outcomes of systemic racism are not accidental,” said Frank Ridzi, vice president of community investment at the Community Foundation. “Decades of public and private policies pertaining to residential development, financial lending and transportation planning have led to poor outcomes for our neighbors of color. Until we are all made aware of and address these inequities, structural racism will continue to undermine our efforts to improve literacy and education rates, increase positive health outcomes and break down the detrimental cycle of generational poverty.”

Each visualization is accompanied by an analysis explaining how the facts relate to residents and the region’s prosperity. Visitors can download the raw data for each indicator in a variety of formats or connect it to programs using live APIs. The visualizations can also be embedded in outside websites or shared on social media to spur discussion. Visitors to the site will find news announcements about local trends, stories from members of the community and ideas on how they can do their part.

The new racial equity data is also available on the specialized arm called CNY Vitals Pro, a more in-depth site designed for grant writers, researchers, community organizers and data professionals. It allows users to drill down into statistics by county, town, city, zip code or census tract and compare them at the local, state or national level.

View racial equity section on CNY Vitals.

Share

Housing and Homeless Coalition Releases Report on State of Homelessness in CNY

Guest Article: Megan Stuart, Director of Housing & Homeless Coalition, United Way of Central New York

Photo Credit: A Tiny Home for Good

The Housing & Homeless Coalition of Central New York (HHC) is a network of organizations committed to ending homelessness and housing vulnerability in Central New York. Each year, the HHC conducts its Point in Time count, a census of all people experiencing homelessness in our three-county region which includes Onondaga, Cayuga, and Oswego counties. This effort includes data collected in the Homeless Management Information System database and a full canvas of our geographic region. Over 100 volunteers go out on one night in January to ensure that we are getting the most accurate and complete count of people experiencing homelessness. Our volunteers also canvas soup kitchens and day centers asking where people are staying.

This count has demonstrated that our community was making progress in ending homelessness. Prior to the pandemic, our community was seeing decreases in homelessness year over year, resulting in a 25% decrease from 2015 to 2020.[1]

But now, homelessness is on the rise. From the count in 2022 to the count in 2023, there has been a 30% increase in overall homelessness, totaling over 800 people staying in emergency shelters or places not meant for human habitation on a given night. This number is higher than any count we’ve had since 2015.

These increases are particularly affecting families, as the three-county region has had a 41% increase in families with minor children experiencing homelessness, with a majority of these families never facing homelessness in the past. 75% of households who entered homelessness last year, did so for the first time. Homelessness has adverse effects on health outcomes, educational outcomes for children, and even affects life expectancy, at an average of 20 years less than people who are housed.[2]

The report also identified the following trends in homelessness:

  • The number of people experiencing unsheltered homelessness increased by 190% (from 10 people in 2022 to 29 people in 2023)
  • 39% of children who experience homelessness are under the age of 5
  • Unaccompanied youth (age 12 to 24) increased 32%, from 42 to 62 youth in emergency shelter.

Overall, the Point in Time count demonstrated that people are at higher risk of homelessness than any other time in recent history. Though the community is seeing drastic increases in people being unhoused, the good news is we know what works- re-housing people as quickly as possible into quality, affordable housing, and stabilizing families with wrap around services. Each year, programs providing subsidies and case management services see over a 95% success rate in housing retention.[3] There is now a demonstrated need for the expansion of essential programs to assist in creating avenues to permanent housing. Now more than ever, it is critical to the health of the community that our neighbors have a safe place to live as it is the key to ending homelessness.

To read the entire report, visit the HHC’s website at hhccny.org


[1] All data is taken from the HHC’s Point in Time Counts unless otherwise specified.

[2] https://www.usich.gov/news/remembering-those-we-have-lost-and-the-work-that-remains/

[3] HHC’s System Performance Measures, 2022, hhccny.org

Share

Barriers to Access for Deaf New Americans

Guest Article: Monu Chhetri, Founder, CEO, Deaf New Americans Advocacy

It is extremely important for Deaf New Americans to learn about and work to end lead poisoning in our community. I grew up in refugee camps where there was no lead paint, and where we use natural fibers and materials from the land.

I have been here in Syracuse for over 12 years, and I just learned about lead in the paint and the possibility of lead poisoning. I had no idea that we could be victims of this until I learned, about it from our friend Qiana Williams of CNY Community Foundation who invited us to their sponsored participatory budgeting project with the goal to end lead poisoning. Our board members from the Deaf New Americans Advocacy (DNAA) attended, and we became very aware of the danger of lead to ourselves and our children. We learned that it’s not just in the paint that’s on surfaces, it’s in dust that comes from daily opening and closing of windows and doors. We became alarmed and so concerned, especially because of the young children in our community. We learned that our babies born outside of the US and even born here needed to have screenings done. We understand that lead can damage their developing brains. It is scary.

DNAA became very involved in the participatory budgeting process, where all the participants had an opportunity to express their ideas for how we could educate the community and work to end lead poisoning. After listening to presentations and ideas from participants, we were able to vote on ideas. It was a very exciting and engaging democratic process. We feel it was a good way as a small group to work to affect change community wide. We felt listened to, and I feel like it was a very useful process and experience. We hope that we can make this change together.

There are many barriers to accessing language and communication for the Deaf New American community. It’s a problem for Deaf people. We need to learn all this important information so we can protect ourselves and our families, but if we are not included or the community forgets, then Deaf people are usually the last to know what’s going on. This makes us at risk, endangered. When the community remembers to invite the Deaf New Americans advocates to come to public events such as this one, we can learn about any dangers that are exposed to the community and give residents access to the information using interpreters and accessible information.

Currently, lead is very serious, so we the DNAA hope to receive funding to provide education using sign language interpreters and to record video announcements. We can do local interventions by going one on one to families in their homes with our knowledge and use of culturally aware communication skills. It is our prayer that our community stays safe and thrives, and we are grateful that the Community Foundation has shown how they support us.

Share

Taxing Barriers: Using Data to Overcome Predatory Tactics, Maximize Refunds, and Further Free Tax Preparation for all

Guest Article: Todd Goehle, Community Engagement Director, PEACE, Inc.

Albert Einstein quipped, “The hardest thing in the world to understand is the income tax.” If a Nobel Prize Winning Physicist can’t understand it, what are the rest of us supposed to do? Especially when we have to organize financial documents and navigate unfamiliar tax terms? The stakes are even higher for Central New York’s residents of under-resourced neighborhoods and those who have been historically excluded from opportunity. Where can one turn when legacies of discrimination (i.e. racism, ageism, ableism, and more) and neighborhood disinvestment continue to limit one’s access to a full tax return and stabilizing if not potentially transforming capital?

One critical resource is the free tax preparation service offered through the IRS Initiative named VITA (Volunteer Income Tax Assistance Grant Program). In Central New York, VITA partners with the CNY CA$H Coalition, a United Way of CNY Initiative, to “help low- to moderate-income individuals, persons with disabilities, elderly people, and limited English speakers file their taxes each year.” This year, any household making under $60,000 a year will be eligible for the service. To ensure confidentiality and quality, all VITA volunteers must pass a series of certification exams. As a CNY CA$H Coalition member, PEACE, Inc. offers the largest local location and one of only a handful of year-round, Free Tax Preparation sites in the state. Last year alone, more than 1600 households with an average annual income of $25,000 took advantage of PEACE, Inc.’s program.

VITA sites not only help underserved clients overcome the average $220 tax preparation fee and earn a full refund; They also combat predatory tactics such as refund anticipation loans and checks that impose excessive fees and take money out of the pockets of people working hard to make ends meet. For example, this past summer, a mother of two came to PEACE, Inc.’s Free Tax Prep Program. Earlier in the year, a national tax service prepared the mother’s taxes for the year. The firm charged $680 for the service and a loan that advanced her tax return. The story worsens. Like many during COVID, the woman required assistance e-filing her 2020 taxes. The firm again looked to charge $680, yet this time requiring an upfront fee to prepare any back tax return. If not for PEACE, Inc., the woman would have paid a total of $1360 in fees, more than 15% of the mother’s taxable income for the year.

To raise awareness about such practices and the additional Child and Earned Income Tax Credits (CTC, EITC) available to filers in 2022, the Central New York Community Foundation (CNYCF) and the EITC Funders Network partnered to fund a number of local organizations. CNYVitals previously discussed the social media efforts pursued by Layla’s Got You. PEACE, Inc. sought to recruit additional volunteers and to target traditionally underserved residents in high poverty neighborhoods of Syracuse. Data proved critical in 4 respects. First, PEACE, Inc.’s COVID-19 Community Needs Assessment and Chronicle from June 2020 identified the need for unrestricted capital in neighborhoods, where Black, Latino, Asian/Pacific Islander and Native American people live. These same neighborhoods were disproportionately affected by the COVID-19 pandemic. Second, census tract and IRS data showed those places where residents had yet to claim or historically don’t take advantage of tax credits. Third, members of PEACE, Inc. used CNYCF Life Needs Assessment Survey Data to identify those agencies with clients who would be good fits for the program because they responded that they “didn’t have enough money to meet their needs and to pay their bills.” Finally, analyzing internal data further justified PEACE, Inc.’s move to a year-round site. As revealed above, greater outreach yielded many new clients who required past tax season preparation or amendments in the offseason but lacked the funds to meet IRS deadlines.

Embracing a data-driven approach, PEACE, Inc.’s Free Tax Prep Program returned nearly 3 million dollars to the Central New York economy and an average tax return of nearly $2200. Perhaps more importantly, the program served far more low-income households than in previous years. Clients themselves shared how a quality return brought short-term stability and long-term economic mobility for their households. For example:

-KM, a mother of four, earned $14,879 at her job. Because of the stimulus and tax credits, KM received a tax return of $19,272. As KM explained, “the money will help me and my family get a new car, daycare to work more hours, and the supplies that the baby needs right now.”

-RT, a mother of 3, earned just over $25,000 at her job. Thanks to tax credits, RT earned a refund nearly equal her income, $18,374. As she shared, “I will be putting this refund on a new home for me and my kids. So I’m very thankful and more so excited that this year, I worked so hard and my family can use this to go towards a new home.”

With a new tax season upon us, the CA$H Coalition and PEACE, Inc. are seeking volunteer tax preparers, administrative assistants, interpreters, and greeters/screeners. Hours are flexible. Training is free. Want to make a true impact in our community? To learn more, visit https://www.peace-caa.org/programs/taxes/ or call 315.634.3756 today!

Share

Report Points to Child Care Crisis in Onondaga County

Onondaga County has a big problem, and it’s impacting our littlest residents: children under the age of five. There are approximately 12,000 children in our community who need child care but cannot access it because there simply isn’t room for them.

High quality child care is important – we know that access to high quality early child care helps build foundational skills that are necessary for success in school, career, personal health, and life. Comprehensive studies suggest that high quality early child care leads to greater school readiness, grade retention, academic achievement, high school completion, family stability, employment, higher income, home ownership, reduced health care expenses, and less crime. (CITE 1). We also know that, due to child care breakdowns, businesses in the United States suffer an economic loss of $12.7 billion each year. (CITE 2).

The Early Childhood Alliance (ECA) was launched in 2015 with the bold vision that all children in Onondaga County are healthy, thriving, and ready to succeed in school and in life. Composed of a diverse cross-section of community stakeholders impacting the county’s early childhood system, the ECA is committed to advancing bold solutions that are evidenced-based and grounded in family and community voice. In the summer of 2021, as we moved into the immediate aftermath of the COVID pandemic, the ECA felt it important to take a step back and really focus on the accessibility of child care in our community. A year of research later, the ECA has released its new study entitled, The Child Care Landscape in Onondaga County: A Supply & Demand Analysis. This study dives deep into how families can (or can’t) access child care in our community. We encourage you to read the whole thing, but here are a few key points for you to consider:

  • We only have enough licensed and regulated child care to meet 44% of the demand. Between 2019 and 2021, the number of child care slots in Onondaga County dropped by 27%. In 2019, there was a supply gap of 8,574 child care slots and in 2021, that gap grew to 12,123.
    • Families shared their lived experience of attempting to access child care: “I was told, ‘We’ll put you on the waitlist,’ but she’ll be in pre-K before a spot opens up in the daycare rooms.”
  • Child care is expensive: in Onondaga County, the average cost of care for a four-person family with an infant and a toddler is $24,336. For a two-parent family earning the median income of $61,359, this means that 40% of household income would be spent on child care.
  • Child care assistance can help many families pay for the cost of care, but families are not taking advantage of this resource. In the last 6 years, the number of families who have utilized child care assistance has decreased 59%. Right now, only 19% of the families that are eligible for subsidized care are taking advantage of this public benefit.

You can read the full report to learn more about the state of child care in Onondaga County.

Citation 1: Heckman, J. J. (2012). Invest in early childhood development: Reduce deficits, strengthen the economy. The Heckman Equation, 7, 1-2.
Citation 2: Child Care Aware of America; The US and the High Price of Child Care, 2019 Report.

Share

LAYLA’S GOT YOU ASSISTS IN EITC EDUCATION

EITC photo

Tax season is dreaded by many. Oftentimes, people find that it’s overly complex and tedious to get finances organized to complete the near never-ending forms. But for some, there is the opportunity to collect needed funds by properly completing the process.

The Earned Income Tax Credit (EITC) is a refundable tax credit geared towards middle, and low-income adults, oftentimes with children. However, many individuals who are eligible to file inevitably don’t, as they assume they do not qualify. This results in unused credit that could have improved the lives of thousands of families.

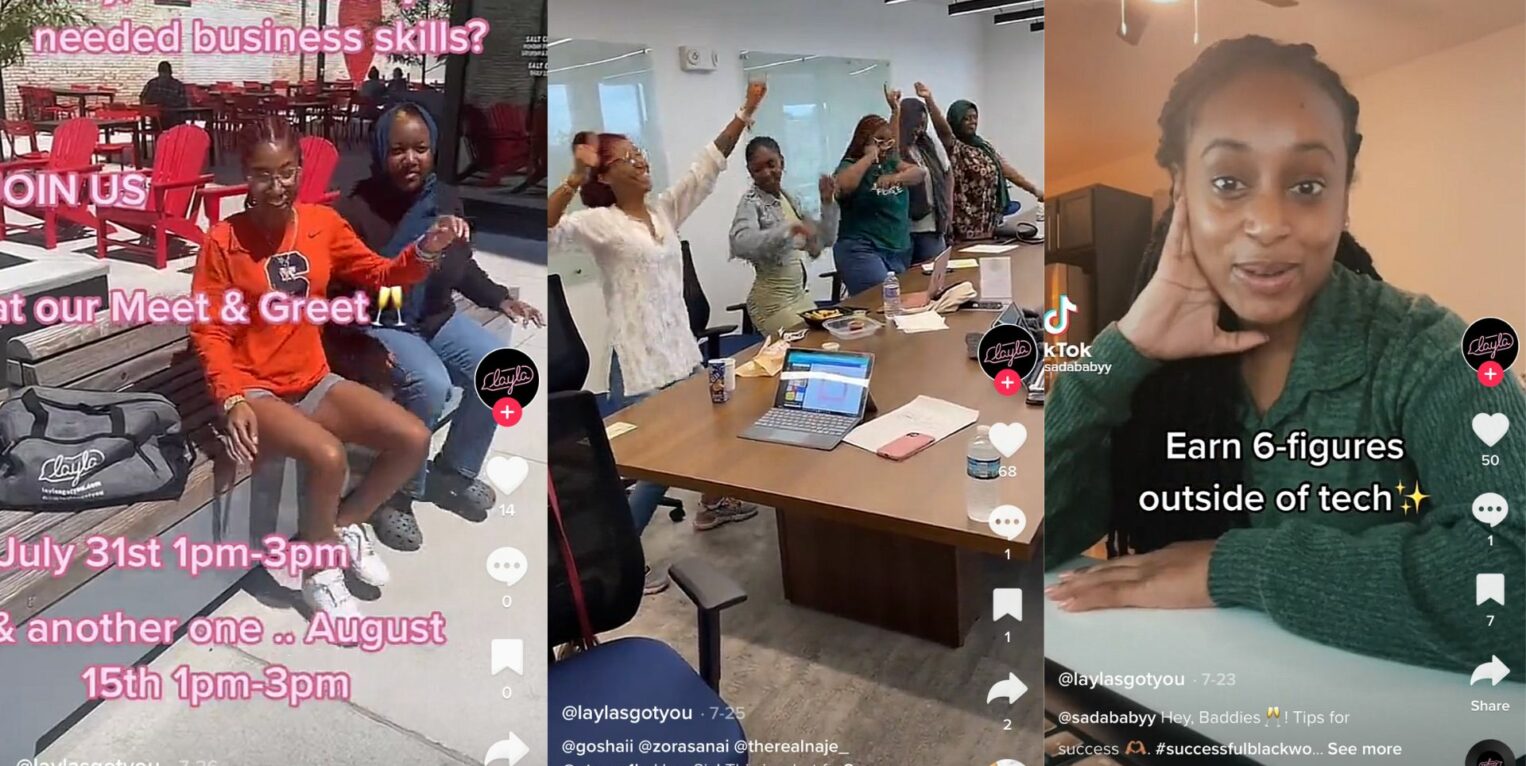
Layla’s Got You, an organization dedicated to using social media to connect Syracuse residents with women’s health information, partnered with the Central New York Community Foundation to inform and assist filers by spearheading a comprehensive social media campaign. Using the talents of its young ambassadors, the organization has been able to provide accessible information about the EITC and potential tax refunds to individuals that may qualify.

Qiana Williams, a program officer at the Central New York Community Foundation, emphasized the importance of young voices.

“It was very exciting to be a part of this collaboration to utilize young, trusted ambassadors to carry a message forward to the community,” she said. “When the opportunity to partner with Layla’s Got You arose, we felt it would be an effective way to identify young people who could help efficiently get out information about the EITC.”

Jayah Pierce, a 19 year old who has been an ambassador for Layla’s Got You since she was 14, emphasized the impact that finances and other factors play into the organization’s primary mission. “Financials really do impact the way you live, what you can do and where you’re limited,” she said. “So we really thought, you know, that young people could benefit from having that money back and by getting their taxes in on time and not having to go through owing.”

The cornerstone of the social media campaign was the ambassadors who created the EITC content itself. They used commonly under-utilized social media platforms such as TikTok to spread awareness via messaging that catered to a young audience. Instead of using complex financial language, they opted for simple explanations and comprehensive resource sharing. By hearing from likeminded peers, EITC became a tangible reality for many, rather than an unknown program.

Hearing information from ambassadors that could connect to their fellow neighbors reduced the likelihood that filers would scroll past information, and instead ask questions.

“We explained to social media users that you might get money back, like we’re young. So if you can get up to $1,500 back, get your bag, like go get your money,” said Pierce. “We’re the same age, [and] it really works out because, you know, if you see something that looks like a scam, you scroll, but if you see your best friend saying it, you’re more likely to take it seriously and apply.”

The EITC program directly benefitted several individuals and families across the Central New York area, often with life-changing effects. For example, Layla’s Got You has worked with a young mother that received over $18,000 in tax refunds. She makes just over $25,000 per year at her job.

“This year’s income tax is great,” she said. “I will be putting this tax refund toward a new home for me and my kids. So I’m very thankful and so excited that this year my hard work will benefit my family in such a big way.”

Share

Innovation in Action: Data Dating

City highways and lights.

The world of dating has been forever-changed by the Internet. Applications such as Tinder, Bumble and Hinge have allowed for individuals separated by time and space to connect based upon shared interests, without ever needing to meet one another face to face. For better or for worse, this has led to an unprecedented level of digital connectivity unlike the world has seen before.

But what if this new technology could be used for a different purpose—for the betterment of communities, outside of pixilated messages and swipes? For Dr. Frank Ridzi, vice president, community investment at the Central New York Community Foundation, the idea wasn’t so farfetched.

Ridzi is a lover of data. He thrives on the excitement of recognizing trends between nonprofit groups in the Central New York community, and using data to allocate aid accordingly. Utilizing the Life Needs Assessment, a survey offered to various non-profits in the area, Ridzi pioneered the concept of “Data Dating.”

The Life Needs Assessment is quite simple; surveyed respondents answer succinct, straightforward questions such as “Do you have dependable and safe transportation when you need it,” and “Do you have long-term housing that you can afford.” Respondents are also asked to provide basic, demographic information on age, race, and neighborhood, among others, to analyze which communities are in need of certain resources.

The most crucial aspect of the survey is that it is completely confidential. Anyone who is served by a nonprofit organization has the opportunity to take the survey. Privacy is integral to data gathering, and the assessment never shares names in the process to protect respondents.

Similar in the way dating apps match users with one another based upon common interests, data dating uses survey responses to pair different nonprofits with one another based upon their clients’ needs and strengths. In all aspects of their operations, where one organization flourishes, another may struggle. Data Dating allows for different organizations to connect based upon mutually beneficial partnerships, and ultimately leads to better services for the communities the nonprofits represent.

PEACE, Inc. used Data Dating resources to partner with organizations that have similar missions to further enhance its work. Todd Goehle, community engagement director at PEACE, Inc., cited the importance of holistic data collection and collaboration with other organizations.

“The data that we’re accumulating doesn’t necessarily reflect the community at large,” he said. “This tool gives us opportunities, especially with live mapping, to identify locations where interventions can be made.”

The survey allows organizations to combine both qualitative and quantitative data to paint a better picture of the needs in communities. For example, during the onset of COVID-19, there was a common narrative that the most need-based resource was food. However, it became clear through surveyed respondents that there was a greater need for things like jobs, assistance paying bills, computers and internet connectivity. This data made it easier for organizations to identify the areas that needed attention and quickly shift resources to address them.

Pairing nonprofits together in order to more efficiently and effectively achieve their goals is the first step in creating a better quality of life for Central New York residents. Not only does the method of Data Dating facilitate a culture of partnership, but it ensures resources are allocated in an equitable and impactful way


Share

Building Sustainability for the Arts Community

During the onset of the COVID-19 pandemic, the arts and culture sector was among the hardest-hit. As residents remained shuttered in their homes, movie theaters, actors, arts organizations and independent artists struggled to sustain themselves — unable to share their talents. With support from the CNY Arts COVID-19 Impact Fund, emergency assistance provided them with a critical lifeline when they needed it most.

While the arts is commonly thought of as a “niche,” and small industry, the Arts & Culture Impact study in 2019 found that “greater Syracuse’s arts and culture industry generates more than $148 million in economic activity, supports nearly 6,000 full time jobs, generates $125 million in household income and delivers over $21 million in local and state government revenue,” while providing cultural and artistic talents that bring life to the Central New York community.

The arts and cultural sector is composed of myriad industries such as film, advertising, and digital and visual arts, as well as specific individual occupations like performers, musicians, architects, graphic designers, and curators. In addition to its direct contributions to the economy, the arts and culture sector supports and is supported by other professions, such as nonprofit administrators, promoters, accounting, and finance, further magnifying its economic footprint.

“At CNY Arts, we believe that a healthy arts industry is essential to the quality of life and community in Central New York,” said Steve Butler, executive director of CNY Arts. “The industry has been hit much harder than expected by the coronavirus pandemic and its fallout.”

Despite its importance, the arts in Onondaga County experienced a sharp decline in employment even before the pandemic. In 2018, total arts employment numbers in Syracuse dropped from 3,624 to 1,823. The decline not only hurt the sector, but exacerbated Central New York’s gender employment gap in the arts, with only 716 women in the industry in 2018. Since 2009, women have not come close to reaching equal employment numbers compared to their male counterparts – the closest they came was in 2012, when the gap was composed of only 44 people. However, 2019 data implies that women’s arts employment has begun to rise, with 745 women.

As the pandemic continued to disrupt all aspects of our lives, it became apparent that the arts was an area that needed immediate attention. Without patrons visiting museums, productions, shows and exhibits, independent and organized artists struggled to make ends meet. For live arts performers, the closing of venues presented an acute barrier to employment. According to CNY Arts, it is estimated that independent artists lost over $12,000, while organizations lost over $200,000.

CNY Arts realized the need to support local arts, and the community foundation partnered with them to carry out that vision. In August of last year, they had the opportunity to build a campaign fund with CNY Arts designed to support arts organizations in Central New York impacted by the pandemic: the CNY Arts COVID-19 Impact Fund. Specifically, this fund supports artists and nonprofit arts organizations in three categories: restart, reopening, and resiliency.

All contributions made to the CNY Arts COVID-19 Impact Fund were matched dollar-for-dollar, up to $175,000, by the Community Foundation, The Dorothy and Marshall M. Reisman Foundation and the John Ben Snow Foundation. As of Labor Day, CNY Arts reached its $1 million goal for this fund.

“Donations to the CNY Arts COVID-19 Impact Fund helped provide resiliency grants to artists and arts, culture, and heritage organizations in the seven county CNY Arts region,” said Butler. “Funding has been critical to these arts and cultural providers as they work to restart, reopen, and serve our communities as we heal and rebuild.”

Grants were allocated to the CNY Jazz Arts Foundation, the Erie Canal Museum, the Everson Museum of Arts of Syracuse and Onondaga County, Musical Associates of Central New York, Inc., Red House Arts Center, the SU Theater Corporation, among other talented, independent artists and organizations. Due to the slow process of reopening, CNY Arts will keep issuing grants through 2022.

“CNY Arts is committed to ensuring that our arts, culture, and heritage sector will survive and thrive and the Central New York Community Foundation is proud to be a resource to them in this work,” said Peter Dunn, President and CEO of the Central New York Community Foundation.


Share