
Contributing Authors: Jared Shepard, Director of Planning and Research at CenterState CEO & Skylar Richardson, Impact & Evaluation Coordinator, CenterState CEO
Central New York’s economy is growing. After more than a decade of federal and state investment in industrial policy, employment growth in 2025 reached its highest level since the late 1990s, signaling the start of a new era of economic opportunity for the region. However, in line with national trends, recent job gains have been concentrated among large firms. Although total employment increased, most net new jobs were created by major employers, while many small and mid-sized businesses saw their workforce shrink.
This divergence matters. Small and mid-sized businesses account for more than half of regional employment and serve as the principal vehicles for local ownership, neighborhood stability, and wealth creation. They are the institutions through which macroeconomic growth becomes embedded in communities. When employment growth bypasses these firms, the region’s expansion becomes narrower, less locally rooted, and less likely to translate into broadly shared prosperity.
Reversing the decline in small business employment will require more than continued aggregate growth. Structural barriers, shaped in large part by decades of racially discriminatory policies, along with other forms of exclusion, continue to constrain who can start, scale, and sustain businesses in the region. Practices that still exist today, such as predatory and discriminatory lending, suppress entrepreneurial participation, limit access to capital and contracts, and reduce labor market mobility. The cumulative effect is substantial: across Buffalo, Rochester, and Syracuse, an estimated $17 billion in annual economic activity remains unrealized.
Strengthening small- and mid-sized businesses, therefore, is not only a matter of equity but of economic performance. Targeted investment in historically and currently excluded entrepreneurs and workers would expand business formation, stabilize employment, and enable the region to more fully capture the gains associated with large-scale industrial investment. In this context, inclusive growth is not a secondary objective, it is central to the region’s long-term competitiveness.
Regional Employment Trends
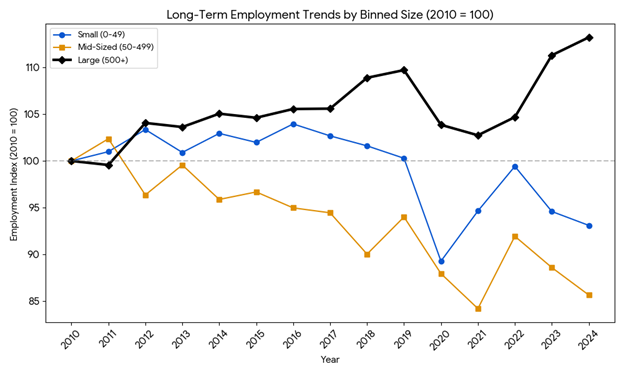
Based on data from the Quarterly Workforce Indicators (QWI) ,a comprehensive database from the U.S. Census Bureau that tracks local employment movements—the Syracuse Metropolitan Statistical Area (MSA) is experiencing a historic shift in its employment landscape. While the region reached record-high total employment levels in 2024, the growth is increasingly concentrated in large-scale enterprises, while smaller firms struggle to regain their pre-pandemic footing.
Indexing the data to 2010 provides a longer-term perspective on this shift within the Syracuse economy, revealing that the current “K-shape” is not just a post-pandemic phenomenon but a continuation of a decade-long trend, with strong acceleration starting in 2022.
Key Trends Since 2010:
- Large Business Dominance: Large firms (500+ employees) have shown the most consistent and resilient growth. As of 2024, employment in large businesses increased by more than 13% relative to its 2010 level.
- Small Businesses (0–49): While they saw a temporary boost around 2022, they ended 2024 at approximately 93% of their 2010 workforce levels.
- Mid-Sized Firms (50–499): This segment has faced the steepest long-term decline, now operating at just 85.6% of its 2010 employment levels.
While record-high employment in large-scale enterprises provides a strong foundation for Central New York, the long-term health of our communities depends on a thriving small business sector to serve as a stabilizer. Transforming our regional corridor requires removing barriers that limit full participation in ownership and revenue growth, particularly for entrepreneurs from historically under-resourced backgrounds.
Racial Disparities in Business Formation and Revenue
While major regional drivers like Micron indicate a new era of growth, the small business scene in the Syracuse, Buffalo, and Rochester corridor remains significantly underdeveloped for entrepreneurs of color. Current data shows a stark racial gap in business density and revenue.
Across Syracuse, Rochester, and Buffalo, the gap in business formation remains large and consistent: White-owned businesses range from 16 to 18 per 1,000 residents, while Black-owned businesses range from 2.3 to 4.7 per 1,000 residents. These disparities are not the result of differences in talent or effort, but of unequal access to capital, networks, and opportunity compounded over time.
While the typical white-owned business in the area earns between $3 million and $3.6 million annually, Black-owned companies average between $846,000 and $1.1 million.[1] Bridging these gaps could serve as a major boost to the regional economy. Achieving ownership and revenue equality could generate more than $17.6 billion in new annual economic activity.
How we calculated the gap:
- We start with a simple question: what would regional business revenue look like if Black residents had the same opportunities and participated in business ownership at the same rate and scale as White residents?
- First, we use population data to estimate how many Black-owned businesses would exist if Black residents owned businesses at the same rate per 1,000 people as White residents in the same metro area.
- Next, we estimate the revenue those businesses would generate by applying the average revenue of White-owned firms in that market. This provides a realistic, local benchmark.
- We then compare that expected revenue to actual revenue generated by Black-owned businesses today.
- The difference between the two reflects economic activity that is hindered by ongoing barriers to entry, growth, and scale in the local economy, stemming from generational ownership barriers.
- Using this population-parity approach, we estimate that Buffalo, Rochester, and Syracuse together are missing approximately $17.6 billion in business revenue each year.
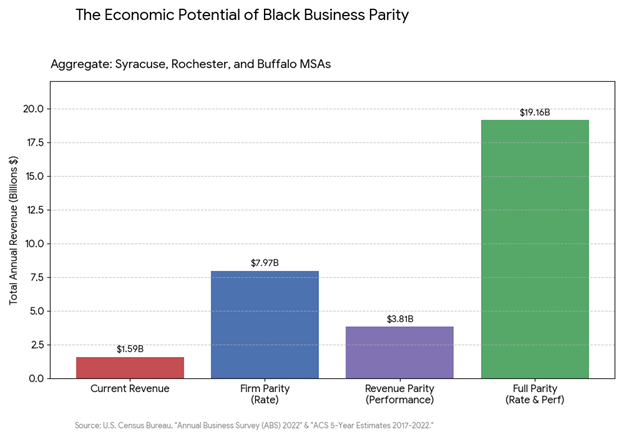
The “Missing Economy” breakdown:
- Current Revenue ($1.59B): The current combined annual revenue of Black-owned employer firms in the Syracuse-Buffalo-Rochester region.
- Firm Parity ($7.97B): Projected revenue if Black residents owned businesses at the same rate as white residents (approx. 18 firms per 1,000 people).
- Revenue Parity ($3.81B): Projected revenue if the current number of Black-owned firms achieved the same average annual sales as white-owned firms ($3M–$3.6M).
- Full Parity ($19.16B): The total output if Black-owned businesses matched white firms in both rate and revenue performance.
The data make clear that the region’s “Missing Economy” is not a single-issue challenge, nor one that can be addressed through generalized growth alone. Closing this gap will require reducing barriers to business formation, expanding access to capital and technical assistance, and strengthening pathways for small firms to scale into mid-sized and larger enterprises. These interventions are not peripheral, they are central to ensuring that recent industrial investment translates into durable regional capacity.
Record-high employment among large employers provides an important foundation for Central New York’s economy. But long-term regional stability depends on a robust small-business sector that anchors neighborhoods, broadens ownership, and drives local growth. Persistent ownership and revenue gaps, particularly among entrepreneurs who have historically been excluded, constrain our economy and opportunities for shared prosperity. Narrow participation in the ownership economy limits firm formation, slows scaling, and weakens the region’s overall competitive position.
These disparities are not accidental. Policies and practices that restrict access to property ownership, credit, and fair compensation through mechanisms such as redlining, exclusionary zoning, and discriminatory lending continue to have economic effects. In Syracuse and other cities across the region, these patterns shaped who could accumulate assets and who could not. Because returns to capital compound over time, the effects of exclusion compound as well, producing intergenerational differences in wealth, business ownership, and market participation.
Addressing these structural constraints is therefore both an equity imperative and an economic strategy. Markets function most effectively when access to ownership, capital, and opportunity is broad. Expanding participation in the small business economy would increase firm formation, strengthen local supply chains, and unlock unrealized productive capacity, as reflected in the estimated $17 billion in annual economic activity across Buffalo, Rochester, and Syracuse. In this context, inclusive growth is not ancillary to competitiveness; it is foundational to the region’s long-term economic performance. If we value capitalism for its ideals of creating opportunity, rewarding merit, and driving innovation and human flourishing, then strengthening those ideals requires expanding access to ownership, capital, and growth so more people can fully participate. Doing so is both a moral imperative and a practical strategy for building a stronger, more resilient regional economy.
ABOUT THE AUTHORS

Jared Shepard is Director of Planning and Research at CenterState CEO. His work includes economic and industrial policy analysis, attainable housing development, and inclusive ownership—examining how capital access, policy design, and market structure shape long-term wealth creation in communities.

Skylar Richardson received her undergraduate degree in Psychology from SUNY Oswego in 2025 and has worked at CenterState CEO since then. In her role as Impact & Evaluation Coordinator, she leads data management and analysis efforts, supporting program evaluation and GIS-based insights to inform organizational strategy and reporting.


 For its mainstage productions, more than 80% of those hired to work on Redhouse productions are area residents, who are then joined by out-of-town professionals. It is through the development and career pathing of this local workforce that Redhouse intentionally connects its theatrical work to its robust educational programs. In addition to in-house programs, Redhouse provides arts education in SCSD schools and will be a leading participant with its STEAM High School. By providing training for those aged 6 to 18, the goal is to empower local students with opportunities to develop careers in the arts as designers, directors, technical crew, and performers. The development of these local professionals creates long-term economic impact, enhancing a professional local employment sector to support the increasing entertainment needs of CNY.


Recent Comments