Introduction

Central New Yorkers are resilient individuals who believe in the values of hard work and determination. Here, everyone deserves a fighting chance at success. However, not everyone in our region has an equal opportunity to succeed. Some groups face undeserved and unfair obstacles.

Racial Equity Icon

Long-standing and far-reaching structural systems have been created and sustained over centuries to hinder access to economic, educational and social opportunities for Black, Latino, Native American and Asian/Pacific-Islander people, while also facilitating greater access to those opportunities for White people and their families.

These historic and current policies, practices and systems include housing policies that restrict access to people of color, employment discrimination, unequal access to financial services and capital, education systems that fail to equitably educate all students, racism in health care delivery, racial profiling and inequitable sentencing in policing and criminal justice and many others. These inequities have compounded over generations, impacting decades of family members. This is significantly illustrated by the redlining practices of the 1930s that blocked Black people and people of color from securing real estate, leaving them unable to benefit from a critical opportunity to create and transfer wealth across generations.

As a result of these racist policies and systems, we see disparities in the indicators included in this section, which range from educational assessments to poverty and income to homeownership rates. We invite you to explore the data in this section in the context of the structural and systemic racism that underlies these disparities.

By addressing structural inequities in Central New York, we‘ll move a step closer to ensuring opportunity for all.

Residents & Civic Participation

Population by Race/Ethnicity - Onondaga County

Population by Race/Ethnicity - Madison County

Population by Race/Ethnicity - Oswego County

Population by Race/Ethnicity - Cayuga County

Population by Race/Ethnicity - Cortland County

Population by Race/Ethnicity - Syracuse

Population by Race/Ethnicity - Oneida

Population by Race/Ethnicity - Oswego City

Population by Race/Ethnicity - Auburn

Population by Race/Ethnicity - Cortland City

Volunteerism by Race - New York State

Volunteerism by Race - New York State

Volunteerism by Race - New York State

Volunteerism by Race - New York State

Volunteerism by Race - New York State

Volunteerism by Race - New York State

Volunteerism by Race - New York State

Volunteerism by Race - New York State

Volunteerism by Race - New York State

Volunteerism by Race - New York State

Voter Turnout - New York State

Voter Turnout - New York State

Voter Turnout - New York State

Voter Turnout - New York State

Voter Turnout - New York State

Voter Turnout - New York State

Voter Turnout - New York State

Voter Turnout - New York State

Voter Turnout - New York State

Voter Turnout - New York State

Let's Break It Down

Syracuse holds the most racial & ethnic diversity of the region

Race and ethnicity data are collected by the U.S. Census Bureau according to standards set by the federal government, which have changed over time. The most recent data show that Central New Yorkers who identify as Black, Hispanic, Asian, and Multiracial live throughout the region, but the largest numbers live in the City of Syracuse. In 2021, slightly less than half of Syracuse residents (49%) identified as White Non-Hispanic and over a quarter of Syracuse residents (28%) identified as Black Non-Hispanic. In comparison, in the four rural counties of the region between 89 and 93 percent of residents identified as White Non-Hispanic and only between 1 and 4 percent of residents identified as Black Non-Hispanic.

Every two years the U.S. Census Bureau collects data on volunteerism and voter turnout through its Current Population Survey. Responses are used to provide estimates of these indicators for each state, and estimates can also be calculated for different racial groups. Data estimates for New Yorkers identified as Native and Hawaiian/Pacific Island vary widely over time, in part because they are based on a small number of survey respondents. Estimates based on large populations, such as New Yorkers identified as Black, Asian, and White, are more stable over time. Data for New York State show that over time Black and Asian residents have consistently lower rates of volunteerism in comparison to White and Multiracial residents. These data align with a national trend in which White, educated women are overrepresented among volunteers. This may be due in part to the bias, micro-aggressions, and racism that is experienced by many volunteers who are Black, Asian, and of other marginalized racial groups.

Voter turnout data peaks every four years, during presidential election years, and is lower during the interim years. Black New Yorkers had their highest voter turnout in 2012, the year that Barack Obama was re-elected as the first Black President of the United States. In 2020, White and Black New Yorkers had higher voter turnout than all other racial groups. A 2022 report found that nationally White people are disproportionately represented among voters, whereas Hispanic and Asian residents are underrepresented.

The data presented on this page may contain a margin of error for small racial or ethnic groups. Race and ethnicity categories presented in the visualizations on this page are based on those within the American Community Survey of the United States Census Bureau.

Why Does it Matter?

The opportunity to vote is not the same for everyone

The voting process should be simple, convenient, and fair for everyone. But millions of Americans never make it on the rolls or to the polls, while hurdles such as long lines, limited voting times, or malfunctioning voting equipment block many more. The Voting Rights Act of 1965 was designed to prohibit racial discrimination in voting. But a 2013 Supreme Court ruling opened the door for states to rollback early and mail-in voting options, close community polling sites and implement strict voter ID laws despite one in four Black people not having a current government issued photo ID.

While voters are no longer explicitly excluded by race, voter suppression is a problem in many parts of the country. Some politicians try to win reelection by making it harder for certain populations and demographics to vote. These politicians may use strategies such as reducing polling locations in predominantly Black or Latino neighborhoods, or only having polling stations open during business hours, when many people are working and unable to take time off.

In 2020, Black people were four times more likely than White people to report they did not vote because they left a line that was too long. Three studies using different methodologies and election years found that Black people were forced to wait in considerably longer lines to cast their ballots than White people, concluding that there is systemic bias embedded in our electoral system that makes it more difficult for Black Americans to cast ballots than those who are White.

In our local, state and federal political environments, elections are coming in closer than ever. Voting limitations based in racial bias can influence whose voices are being heard at the ballot box, impacting the policy and representation that governs our well-being.

The opportunity to vote is not the same for everyone

A Local Story

Making voting more powerful

According to the Pew Research Center, our nation’s eligible voter population jumped from 193.4 million to 233.7 million between 2000 and 2018 – an increase of $40.3 million. Voters who are Hispanic, Black, Asian/Pacific Islander or other race or ethnicity accounted for more than three-quarters of that growth.

Despite the impact minority voters have on the outcome of elections, there are distinct barriers that make voting difficult or inaccessible. Sarina Vij of the American Bar Association explained that Voter ID laws have underlying racial biases and prevent those who have been historically marginalized from engaging in active democratic participation. These requirements compel an individual to present his or her ID in order to cast a ballot on Election Day. Obtaining an ID can be costly and requires an individual’s birth certificate, which may be burdensome.

In addition, finding an accessible polling place has proven to be a significant barrier for voters, with only “5 percent of White survey respondents reporting that they had trouble finding polling locations, compared to 15 percent of African American and 14 percent of Hispanic respondents.”

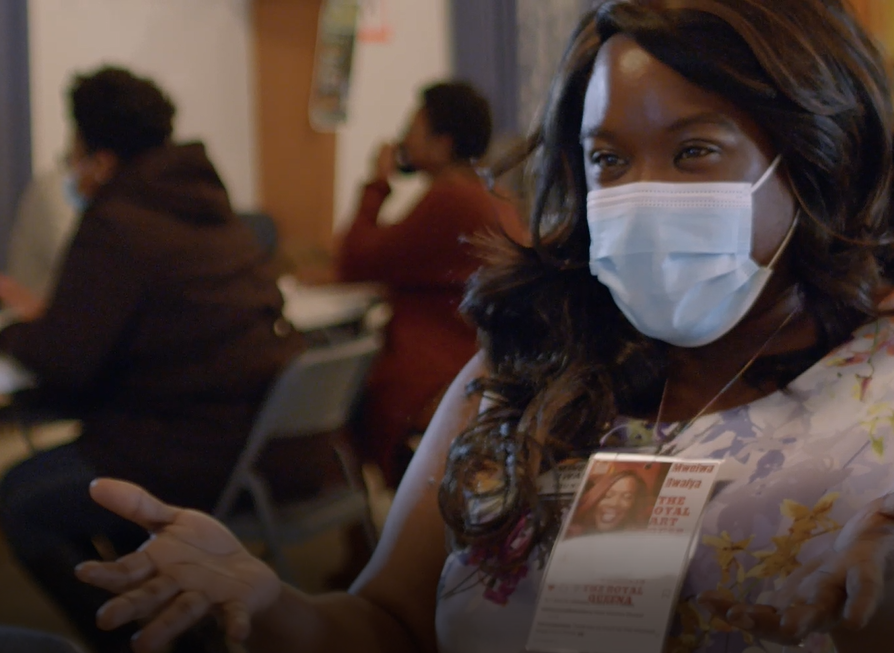
However, the Powerful Voices app has changed how voters interact with policy, registration and political education in Central New York. Developed by Lekia Hill, the app is designed to encourage and increase civic leadership and voter turnout in underserved communities through public and technological platforms one community at a time. As Hill states, the app “challenges the paradigm of status quo among leadership, enabling our Syracuse, NY user base and low-income constituents within the community to advocate for their human rights, immediate needs and issues that impact them most.”

Users can remotely register to vote, access absentee ballot information, and locate their nearest voting place. In addition, the app allows voters to directly view legislation that has passed in both local and federal governments and has a direct message function that connects residents with their representatives quickly and easily.

During the 2022 Midterm Election, attendees were able to meet non-partisan government officials New York State Senator Rachel May, Judge-Elect Ted Limpert, and Assemblywoman Pamela Hunter.

“I want to level the playing field and this is a space, in a way, that we can actually do that because we’re not connecting just only by race,” Hill said. “We’re connecting on issues [that] matter. It makes a difference.”

"Our app challenges the paradigm of status quo among leadership, enabling our Syracuse, NY user base and low-income constituents within the community to advocate for their human rights, immediate needs and issues that impact them most." Lekia Hill

What You Can Do

Give input and get involved.

Whether you’re an experienced volunteer, an activist, a student, working professional, or a stay-at-home parent, there are roles both big and small that you can play to shape the future of the region.

See Additional Opportunities View All
Volunteer
Assist NYCLU with canvassing, protest monitoring and campaign development Learn More »
Donate
Support 10 Less’ efforts to teach local youth about the importance of voting Learn More »
Take Action
Join a community action group Learn More »
Civic Engagement
Join a board Learn More »

Education

Third-Grade Testing by School and Race - Onondaga County

Third-Grade Testing by School and Race - Madison County

Third-Grade Testing by School and Race - Oswego County

Third-Grade Testing by School and Race - Cayuga County

Third-Grade Testing by School and Race - Cortland County

Third-Grade Testing by School and Race - Syracuse

Third-Grade Testing by School and Race - Oneida

Third-Grade Testing by School and Race - Oswego City

Third-Grade Testing by School and Race - Auburn

Third-Grade Testing by School and Race - Cortland City

Degree Completion by Race and Gender - Onondaga County

Degree Completion by Race and Gender - Madison County

Degree Completion by Race and Gender - Oswego County

Degree Completion by Race and Gender - Cayuga County

Degree Completion by Race and Gender - Cortland County

Degree Completion by Race and Gender - Syracuse

Degree Completion by Race and Gender - Oneida

Degree Completion by Race and Gender - Oswego City

Degree Completion by Race and Gender - Auburn

Degree Completion by Race and Gender - Cortland City

Let's Break it Down

Education inequities persist throughout the region

Early education has a profound impact on students’ future outcomes. Third grade test scores provide the first opportunity to examine students’ performance across school districts and by factors such as race and gender. These data show that racial disparities in test scores can be found throughout school districts in Central New York. For example, in 2019 Black third graders in Auburn City School District were less likely to be proficient in Math and ELA tests compared to their White and Multiracial counterparts. Looking at adults’ educational attainment, data from 2021 show that racial differences persist. Less than 3% of Black males in Cayuga County went on to earn a college degree after graduating from high school, whereas the rate among White males was over seven times higher (22%).

In the United States, every child is entitled to equal educational opportunity regardless of race. Yet inequities persist, due in part to school funding. According to a 2019 study from EdBuild, a nonprofit dedicated to fighting education inequality, on average school districts where the majority of students are people of color receive $23 billion less than districts where most students are White, even when they serve the same number of students. Inequitable school resources can impact students’ educational performance and opportunity for success.

 The data presented on this page may contain a margin of error for small racial or ethnic groups. Race and ethnicity categories presented in the visualizations on this page are based on those within the American Community Survey of the United States Census Bureau.

Why Does it Matter?

Not all education is created equal

School is often considered a “great equalizer” for society; a place that provides the same opportunities for everyone to succeed. But when school funding is distributed unequally, it’s hard to make that vision a reality. Public school funding depends heavily on local taxes. While states try to make up the difference between what local communities can raise, they consistently fall short. So wealthier school districts are able to spend more on each student. Students who attend better-funded schools are exposed to educational experiences that make them better equipped to attend high-performing colleges and gain good jobs.

Rather than a great equalizer, the U.S. education system is one of the great perpetrators of intergenerational inequality. Only about half of America’s 50 million public school students attend integrated schools while the rest attend either predominantly White or predominantly nonwhite school districts. This matters because predominantly White school districts get collectively $23 billion more per year to put toward teacher salaries, educational programs and extracurricular activities.

College degrees are often a minimum requirement for jobs. Of the 11.6 million jobs created after the Great Recession, 99% went to people with at least some college education. Student loan debt isn’t equally distributed, with people of color more likely to be at a disadvantage. A 2016 analysis found that more than 90% of African American and 72% of Latino students take out loans to attend college, compared to 66% of White students. Just four years after graduation, 48% of Black student borrowers owe more than they initially borrowed, compared to 17% of White borrowers. Part of the disparity is due to racial barriers to access that impede people of color’s ability to build wealth and upward mobility, including starting with lower levels of family income, wealth, and parental education.

Not all education is created equal

A Local Story

Helping children read to succeed

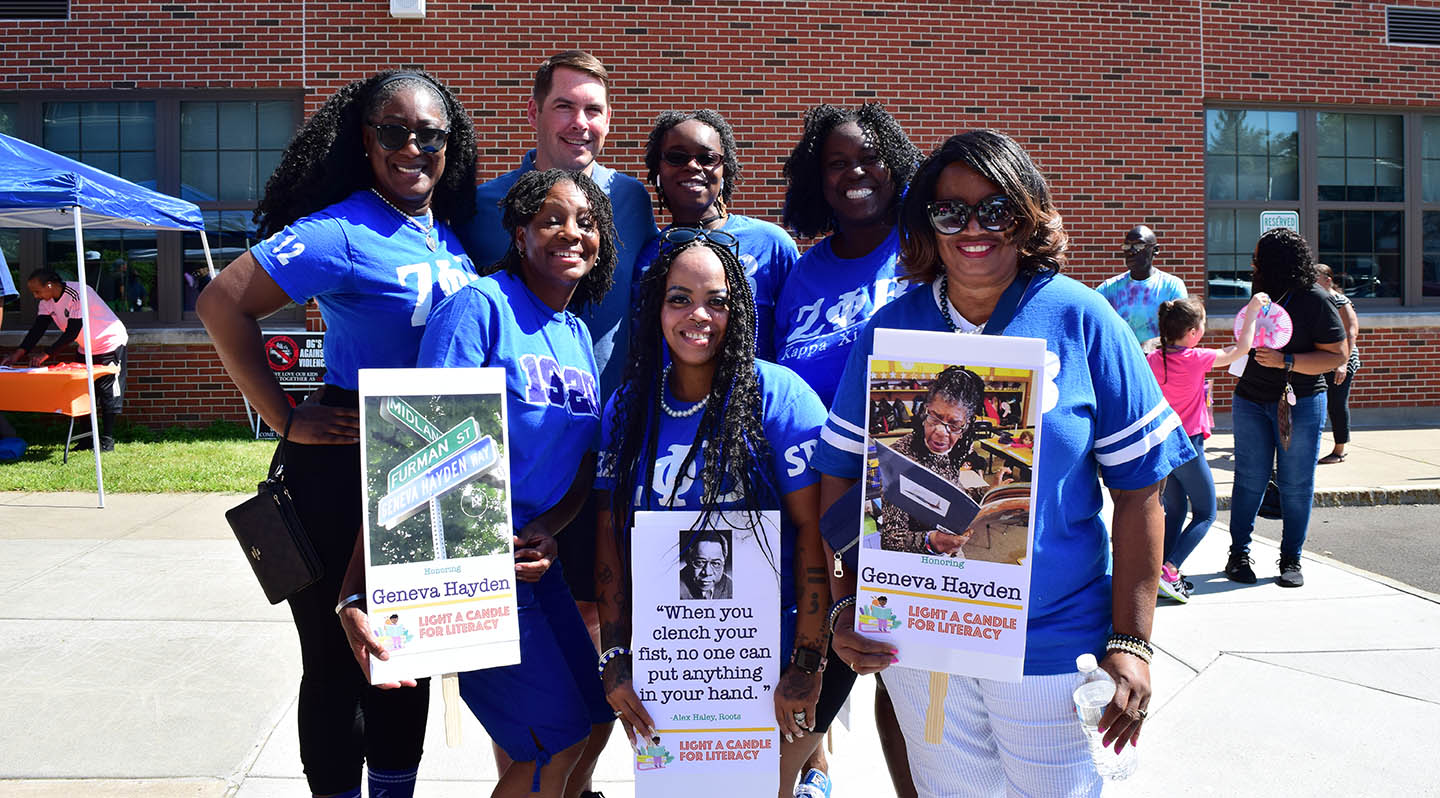
Syracuse resident Geneva Hayden began teaching students how to read from her home. After seeing the need for literacy programming, she created Light a Candle for Literacy, a summer and after-school program for grades K-5 to assist the educational needs of local students, and to inspire respect, honesty, and responsibility.

For the past 30 years, Light a Candle for Literacy has been working to enrich the lives of children through access to free educational opportunities.

“You can’t have education without character because you need both,” Hayden said. “So I do both. That is my philosophy because children have to be able to respect themselves to be able to respect others.”

A child’s early education can impact his or her future significantly. Children who enter kindergarten already behind may struggle to keep up through the remainder of their education. Having access to a strong education between pre-kindergarten and third grade correlates to school success, high graduation rates and low instances of juvenile crime and teen pregnancy.

According to data collected from New York State’s 3rd grade ELA and Math assessments in 2019, just 40% of the students in Onondaga County and 22% in the Syracuse City School District were reading on grade level by 3rd grade, compared to 52% statewide.

Light a Candle for Literacy’s programming is remedying the trend, offering homework help, reading lessons and focused attention on character development. This year, Hayden relaunched The Literacy Parade & Children’s Book Festival, which she created with Edward Kochian, Karen Norton and other members of the community.

“The continued purpose of this event is to increase awareness of the importance of literacy, counteract the summer reading loss in children, and help parents understand the importance of reading to their children daily,” she explained.

The event featured local authors and illustrators, engaging the community and promoting the continued importance of childhood literacy efforts.

“You can’t have education without character because you need both.” Geneva Hayden

What You Can Do

Give input and get involved.

Whether you’re an experienced volunteer, an activist, a student, working professional, or a stay-at-home parent, there are roles both big and small that you can play to shape the future of the region.

See Additional Opportunities View All
Volunteer
Help Partners CNY with education event planning and administrative support Learn More »
Donate
Fund PGR Foundation to support their mentorship program for young girls Learn More »
Take Action
Join a community action group Learn More »
Civic Engagement
Join a board Learn More »

Well-Being & Wealth Accumulation

Housing Tenure by Race Over Time - Onondaga County

Housing Tenure by Race Over Time - Madison County

Housing Tenure by Race Over Time - Oswego County

Housing Tenure by Race Over Time - Cayuga County

Housing Tenure by Race Over Time - Cortland County

Housing Tenure by Race Over Time - Syracuse

Housing Tenure by Race Over Time - Oneida

Housing Tenure by Race Over Time - Oswego City

Housing Tenure by Race Over Time - Auburn

Housing Tenure by Race Over Time - Cortland City

Population Living in Poverty by Race Over Time - Onondaga County

Population Living in Poverty by Race Over Time - Madison County

Population Living in Poverty by Race Over Time - Oswego County

Population Living in Poverty by Race Over Time - Cayuga County

Population Living in Poverty by Race Over Time - Cortland County

Population Living in Poverty by Race Over Time - Syracuse

Population Living in Poverty by Race Over Time - Oneida

Population Living in Poverty by Race Over Time - Oswego City

Population Living in Poverty by Race Over Time - Auburn

Population Living in Poverty by Race Over Time - Cortland City

Population Living Below Poverty Line by Age, Gender and Race - Onondaga County

Population Living Below Poverty Line by Age, Gender and Race - Madison County

Population Living Below Poverty Line by Age, Gender and Race - Oswego County

Population Living Below Poverty Line by Age, Gender and Race - Cayuga County

Population Living Below Poverty Line by Age, Gender and Race - Cortland County

Population Living Below Poverty Line by Age, Gender and Race - Syracuse

Population Living Below Poverty Line by Age, Gender and Race - Oneida

Population Living Below Poverty Line by Age, Gender and Race - Oswego City

Population Living Below Poverty Line by Age, Gender and Race - Auburn

Population Living Below Poverty Line by Age, Gender and Race - Cortland City

Population Below the Poverty Line by Location and Race - Onondaga County

Population Below the Poverty Line by Location and Race - Madison County

Population Below the Poverty Line by Location and Race - Oswego County

Population Below the Poverty Line by Location and Race - Cayuga County

Population Below the Poverty Line by Location and Race - Cortland County

Population Below the Poverty Line by Location and Race - Syracuse

Population Below the Poverty Line by Location and Race - Oneida

Population Below the Poverty Line by Location and Race - Oswego City

Population Below the Poverty Line by Location and Race - Auburn

Population Below the Poverty Line by Location and Race - Cortland City

Population Living in Poverty by Gender and Race - Onondaga County

Population Living in Poverty by Gender and Race - Madison County

Population Living in Poverty by Gender and Race - Oswego County

Population Living in Poverty by Gender and Race - Cayuga County

Population Living in Poverty by Gender and Race - Cortland County

Population Living in Poverty by Gender and Race - Syracuse

Population Living in Poverty by Gender and Race - Oneida

Population Living in Poverty by Gender and Race - Oswego City

Population Living in Poverty by Gender and Race - Auburn

Population Living in Poverty by Gender and Race - Cortland City

Let's Break it Down

Homeownership is still unattainable for many groups

There is a large racial gap in homeownership throughout the United States, including in Central New York. The Black-White gap is particularly large, both within the City of Syracuse and throughout the region. For example, in Cortland County in 2021 there were over twice as many White owner-occupied households than White renter-occupied households. In the same year, there were over three times as many Black renter-occupied households as owner-occupied households in Cortland County. Madison County is the only county in the region in which homeownership outpaced rentals among Black and Hispanic residents in recent years.

Homeownership is related to both economic wellbeing and wealth accumulation. Homes typically increase in value over time and help people build equity, but people in poverty can rarely afford to become homeowners. Regional data show differences in poverty rates by race and ethnicity, as well as age and gender. There are large concentrations of Black and Hispanic residents living below the poverty line in census tracts on the Southside and Westside of Syracuse.

 The data presented on this page may contain a margin of error for small racial or ethnic groups. Race and ethnicity categories presented in the visualizations on this page are based on those within the American Community Survey of the United States Census Bureau.

Why Does it Matter?

The racial wealth gap is both dramatic and unequal.

The benefits of wealth extend far beyond the possession of material goods. Wealth allows people to purchase houses in safe neighborhoods, receive necessary healthcare, get a good education, save for retirement, and ultimately pass money down from generation to generation. When a family possesses a large sum of generational wealth, their descendants automatically have a safety net that enables them to start businesses, attend costly universities, and make investments.

The racial wealth gap refers to the disproportionate divide between Black, Latino, Native American, Asian/Pacific Islander and White households’ average wealth. A vast majority of statistics that compare wealth and income among races prove that the racial wealth gap is both dramatic and unequal. Two-thirds of a typical household’s wealth is made up of housing equity. According to the Economic Policy Institute, the median household wealth for White people is $134,230, compared to Black people’s median of only $11,030, or less than 10%. This outcome remains the same for Black families that spend time and money on earning a higher education. Median wealth for Black families whose head has a college degree, for example, has only one-eighth the wealth of the median White family whose head has a college degree.

Housing policies that prevented people of color from acquiring land, created redlining and restrictive covenants, and encouraged lending discrimination has reinforced this racial wealth gap for decades.

Lack of generational wealth puts the community at a severe disadvantage because while White families continue to thrive off of the money they inherit, a considerable amount families of color have to “start from scratch” at the beginning of each generation. This makes it hard for many to purchase homes, attend college, purchase reliable transportation and build equity for their children and grandchildren.

The racial wealth gap is both dramatic and unequal.

A Local Story

Helping people realize their dreams

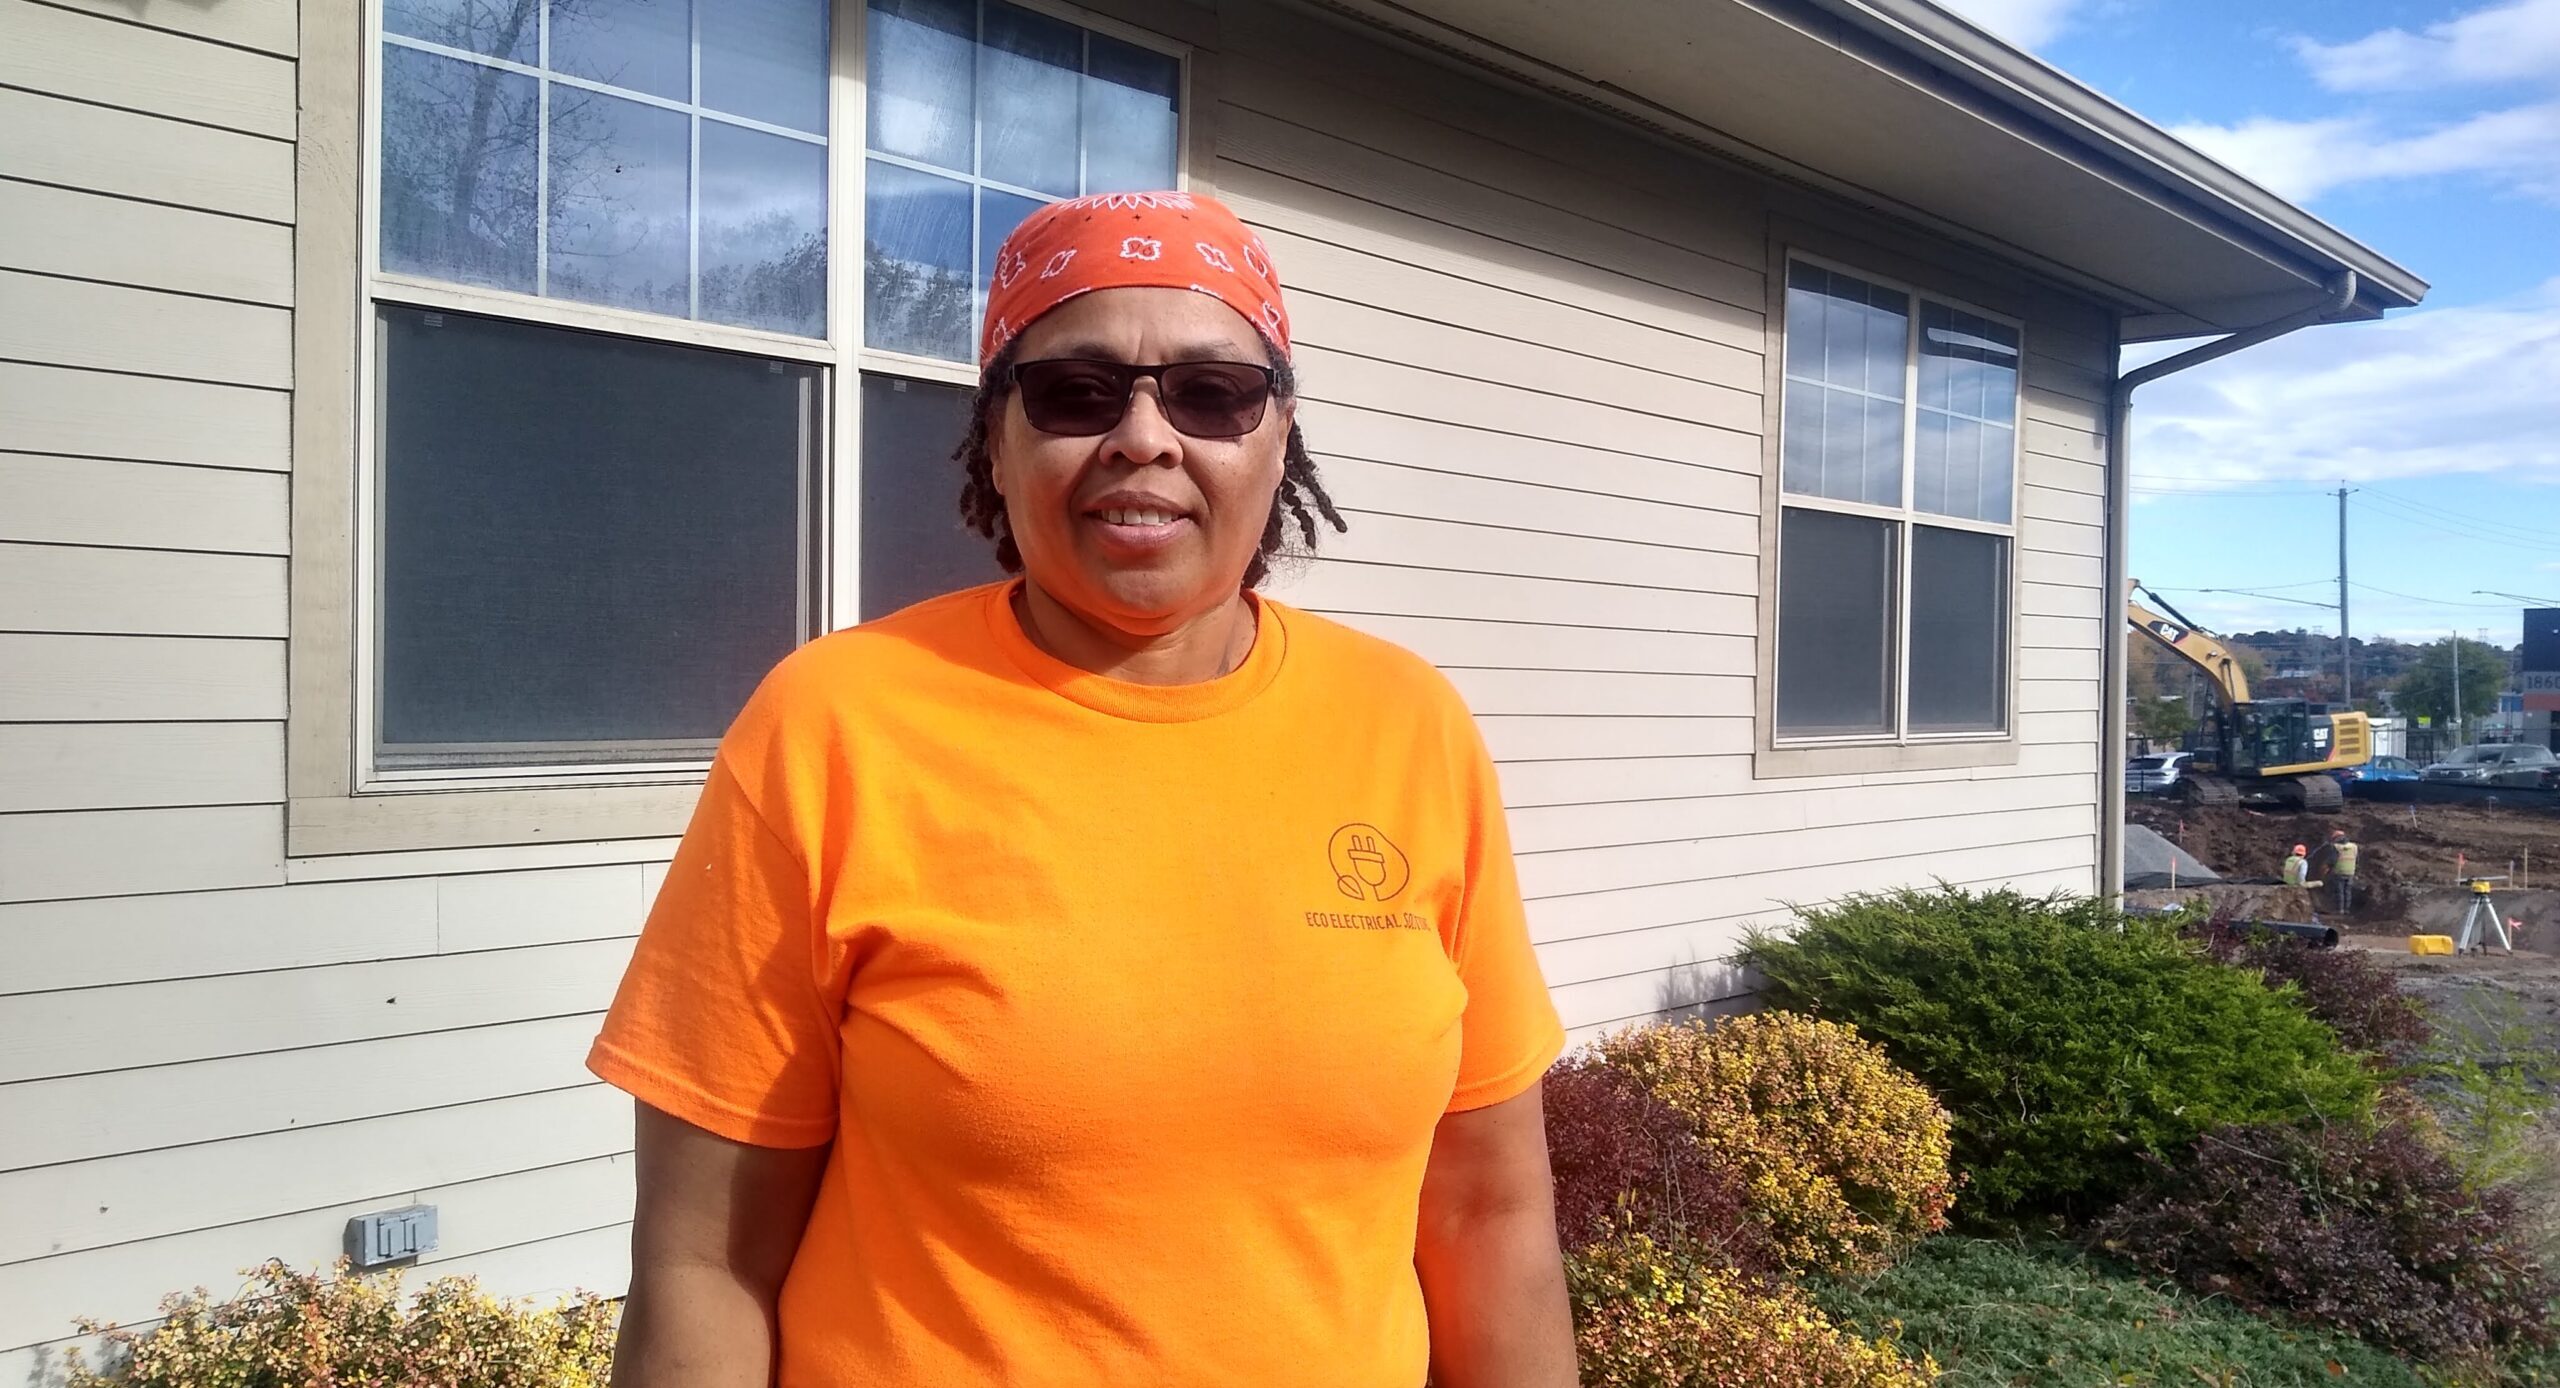
Karen Jones had been turned away by ten separate lenders when she started her small business, EcoElectrical Solutions LLC. When she found Cooperative Federal, it didn’t turn her away. “When I dealt with Cooperative Federal, they were the first institution to actually follow through,” she said.

In 1982, Cooperative Federal Credit Union (Cooperative Federal) opened its doors for the first time, offering a commitment to Syracuse residents, with a desire to invest in under-resourced communities. Forty years later, it remains dedicated to providing financial support for local business and home owners to thrive.

According to the U.S. Census Bureau, in 2022 non-Hispanic White householders had a median household wealth of $187,300, compared with $14,100 for Black householders and $31,700 for Hispanic householders. For Cooperative Federal, remedying these numbers is a cornerstone of its mission, taking a vested interest in working with marginalized communities and uplifting them.

Cooperative Federal is a unique combination of a traditional credit union and a nonprofit community development organization. The pooled savings of its members are invested in the form of loans to help support its members while revitalizing the community at the same time. The organization takes pride in serving its diverse pool of members by providing them with necessary funding to help with their personal or professional ventures.

“Cooperative Federal represents values of cooperation and mutual aid, works to inspire others to these values, and serves communities that are marginalized in the global economy,” said Meagan Weatherby, development & communications manager at Cooperative Federal. “The credit union is part of the movement against injustice, disempowerment, discrimination, corporate irresponsibility, and environmental degradation.”

Focusing on homeownership, personal finances, financial capability and small business ownership, Cooperative Federal has experienced a 5.16% increase in membership, despite the pandemic. The organization enhanced its online and contactless offerings and worked hard to remain a steady force and continue to make financial freedom a possibility for local residents.

Jones was able to acquire a working capital loan and an additional loan to buy a van for her electrical contracting business through Cooperative Federal’s Business Opportunity Fund. Both funding opportunities have helped her business flourish and she has since garnered many new business contracts.

EcoElectrical Solutions LLC, is just one of the many businesses that has received loans from Cooperative Federal. In 2021, it opened 43 small business loans totaling $3,499,389, with 34% being loaned to people of color and women. And it doesn’t stop there. From providing personal banking guidance and financial counseling programs to commercial mortgages, Cooperative Federal views itself as more than just a bank, but really a partner to those it serves.

“Our goal is to utilize our services to help build equity and opportunity for everyone in the community,” said Weatherby. “We know that together we are stronger.”

“Our goal is to utilize our services to help build equity and opportunity for everyone in the community.” Meagan Weatherby

What You Can Do

Give input and get involved.

Whether you’re an experienced volunteer, an activist, a student, working professional, or a stay-at-home parent, there are roles both big and small that you can play to shape the future of the region.

See Additional Opportunities View All
Volunteer
Volunteer at We Rise Above the Streets’ Sandwich Saturday initiative Learn More »
Donate
Improve maternal health outcomes and support families with Doula 4a Queen Learn More »
Take Action
Join a community action group Learn More »
Civic Engagement
Join a board Learn More »

Employment & Income

Business Ownership by Race & Gender - Onondaga County

Business Ownership by Race & Gender - Madison County

Business Ownership by Race & Gender - Oswego County

Business Ownership by Race & Gender - Cayuga County

Business Ownership by Race & Gender - Cortland County

Business Ownership by Race & Gender - Syracuse

Business Ownership by Race & Gender - Oneida

Business Ownership by Race & Gender - Oswego City

Business Ownership by Race & Gender - Auburn

Business Ownership by Race & Gender - Cortland City

Per Capita Income by Race Over Time - Onondaga County

Per Capita Income by Race Over Time - Madison County

Per Capita Income by Race Over Time - Oswego County

Per Capita Income by Race Over Time - Cayuga County

Per Capita Income by Race Over Time - Cortland County

Per Capita Income by Race Over Time - Syracuse

Per Capita Income by Race Over Time - Oneida

Per Capita Income by Race Over Time - Oswego City

Per Capita Income by Race Over Time - Auburn

Per Capita Income by Race Over Time - Cortland City

Per Capita Income by Location and Race - Onondaga County

Per Capita Income by Location and Race - Madison County

Per Capita Income by Location and Race - Oswego County

Per Capita Income by Location and Race - Cayuga County

Per Capita Income by Location and Race - Cortland County

Per Capita Income by Location and Race - Syracuse

Per Capita Income by Location and Race - Oneida

Per Capita Income by Location and Race - Oswego City

Per Capita Income by Location and Race - Auburn

Per Capita Income by Location and Race - Cortland City

Unemployment Rate by Race - Onondaga County

Unemployment Rate by Race - Madison County

Unemployment Rate by Race - Oswego County

Unemployment Rate by Race - Cayuga County

Unemployment Rate by Race - Cortland County

Unemployment Rate by Race - Syracuse

Unemployment Rate by Race - Oneida

Unemployment Rate by Race - Oswego City

Unemployment Rate by Race - Auburn

Unemployment Rate by Race - Cortland City

Let's Break it Down

Income gaps are persisting over time

Per capita income is a measure of the average amount of money earned per person in a community each year. The U.S. Census Bureau data for Central New York reveal differences in per capita income by race, ethnicity, and location. When estimates are based on groups with a small sample size in a community, such as Onondaga County residents identified as Pacific Islanders, the estimates can vary widely from year to year. However, data also reveal many inequities that persist over time. For example, in 2021 the per capita income among White residents in Onondaga County was over $40,000, while the per capita income among Multiracial, Black, and Hispanic residents was only about $20,000. These differences are consistent with national data showing large wage differences between minoritized and non minoritized racial and ethnic groups, and they likely reflect the structural barriers and racial discrimination that many employees face in the workforce.

Unemployment rates vary by race and ethnicity throughout the region, and they generally reveal inequities similar to those seen in the data on per capital income. For example, in Madison County there has been a sharp increase in unemployment among Black residents since 2019, whereas the unemployment rate remained fairly stable among White residents. Indigenous populations also experienced rising levels of unemployment, with rates doubling from 2.8% to 6.7% between 2020 and 2021.

The data presented on this page may contain a margin of error for small racial or ethnic groups. Race and ethnicity categories presented in the visualizations on this page are based on those within the American Community Survey of the United States Census Bureau.

Why Does it Matter?

Racial equity builds wealth

Entrepreneurship is a key driver of wealth creation and generational wealth. Business owners are able to build wealth through their companies, and money spent at locally-owned businesses contribute to local wages and neighborhood development. The U.S. Census Bureau’s Annual Business Survey found that the number of Black-owned employer businesses grew by 8% from 2018 to 2019. Despite these gains, there is still more to do. The Brookings Institute estimates that 800,000 more Black-owned employer firms are needed to reach equity.

The majority of families build wealth by saving the money they earn. Disparities in income for Black, Latino, Native American, Asian/Pacific-Islander people unsurprisingly lead to larger gaps in accumulated wealth. Nationally, White people aged 16 and older earn a median of $1,047 per week, compared to only $791 for Black people and $763 for Latino people.

The gap between racial earnings reflects, in part, the presence of discrimination in the workforce. A 2017 study found that since 1990, White applicants received, on average, 36% more callbacks than Black applicants and 24% more callbacks than Latino applicants with identical résumés. While there are multiple factors that could deter an employer from hiring a certain applicant, it is still evident that there is a noticeable trend of selecting White people over their equally-qualified people of color, which exposes racial bias in the work environment.

Addressing income disparities could go a long way in putting a dent in the racial wealth gap, allowing families of color to save and invest for the financial health of current and future generations.

Racial equity builds wealth

A Local Story

Amplifying the potential of Black entrepreneurs

Ever-changing technology and the advancement of visual mediums have redefined how we consume news and entertainment. Creators are spearheading new innovations every day that they incorporate into podcasts, social media, television and more. For Bishop Ronald Dewberry, this new wave of creativity laid the groundwork for the creation of a new opportunity to fill a gap in Central New York.

As a young man, Bishop Dewberry was enamored by communication, specifically journalism. This love for the field stayed with him through his younger years, but showed him the increasingly prevalent absence of Black creators in the media space. As a result of the pandemic, advancements in media have been fast-tracked to new heights. If there was ever a time to build something new and creative, Bishop Dewberry knew now was his chance.

“It’s well documented that Syracuse struggles with one of the highest poverty rates in the country,” Bishop Dewberry said. “We believe digital media entrepreneurship to be one of the most accessible types of business ownership — at its simplest, media owners can create wealth with a phone, internet connection, and social media presence.”

Bishop Dewberry partnered with Sean Branagan and Daniela Molta of the S.I Newhouse School of Public Communications to create a diverse communications training program for the Black community in Syracuse through his nonprofit, Center of Hope International (CHI). The program, named Black Media Mogul Maker, sports a holistic approach to communications that prepares future Black entrepreneurs for multimedia content creation. For 10 weeks, 25 individuals receive mentorship and training to help turn their media aspirations into a reality.

Black Media Mogul Maker not only emphasizes the entrepreneurial spirit, but realizes the importance of culture in communication. Dewberry cited the successful radio station POWER620, which was recently sold to the radio juggernaut, iHeart Radio. Immensely successful, it reached the ears of the Black community in Syracuse, and provided a unique sense of community for its listeners in a time when there were few mediums for the Black community to tell stories and connect.

The program also provides an opportunity for entrepreneurs to collaborate and build their network, which Molta explained is key to being successful in the field. Upon completion of the program, participants pitch their business venture, competing for additional seed funding for their business.

“Our goal is to provide a roadmap, skills, and community to foster Black media ownership in Syracuse,” Molta said. “In effect, bridging the digital divide, creating generational wealth and diversifying the stories that shape culture.”

With the help of a grant from the Black Equity & Excellence Fund, the CHI was able to hire new staff and speakers to help accommodate the growing demand. Funding was also used to purchase marketing materials and other necessary technology equipment so participants can experience the latest innovations in technology firsthand.

CHI promotes solutions for empowerment, self-sufficiency and sustainability to promote economic and entrepreneurial development, financial literacy, and business acumen for diversity and inclusion. Black Media Mogul Maker has become a successful extension of this mission and the interest in the program has grown significantly.

“The digital revolution has undeniably changed the way we live and interact but it’s still lacking representation of Black voices,” said Bishop Dewberry. “This program is providing the tools for these entrepreneurs to make an impact on the media stories that the community sees.”

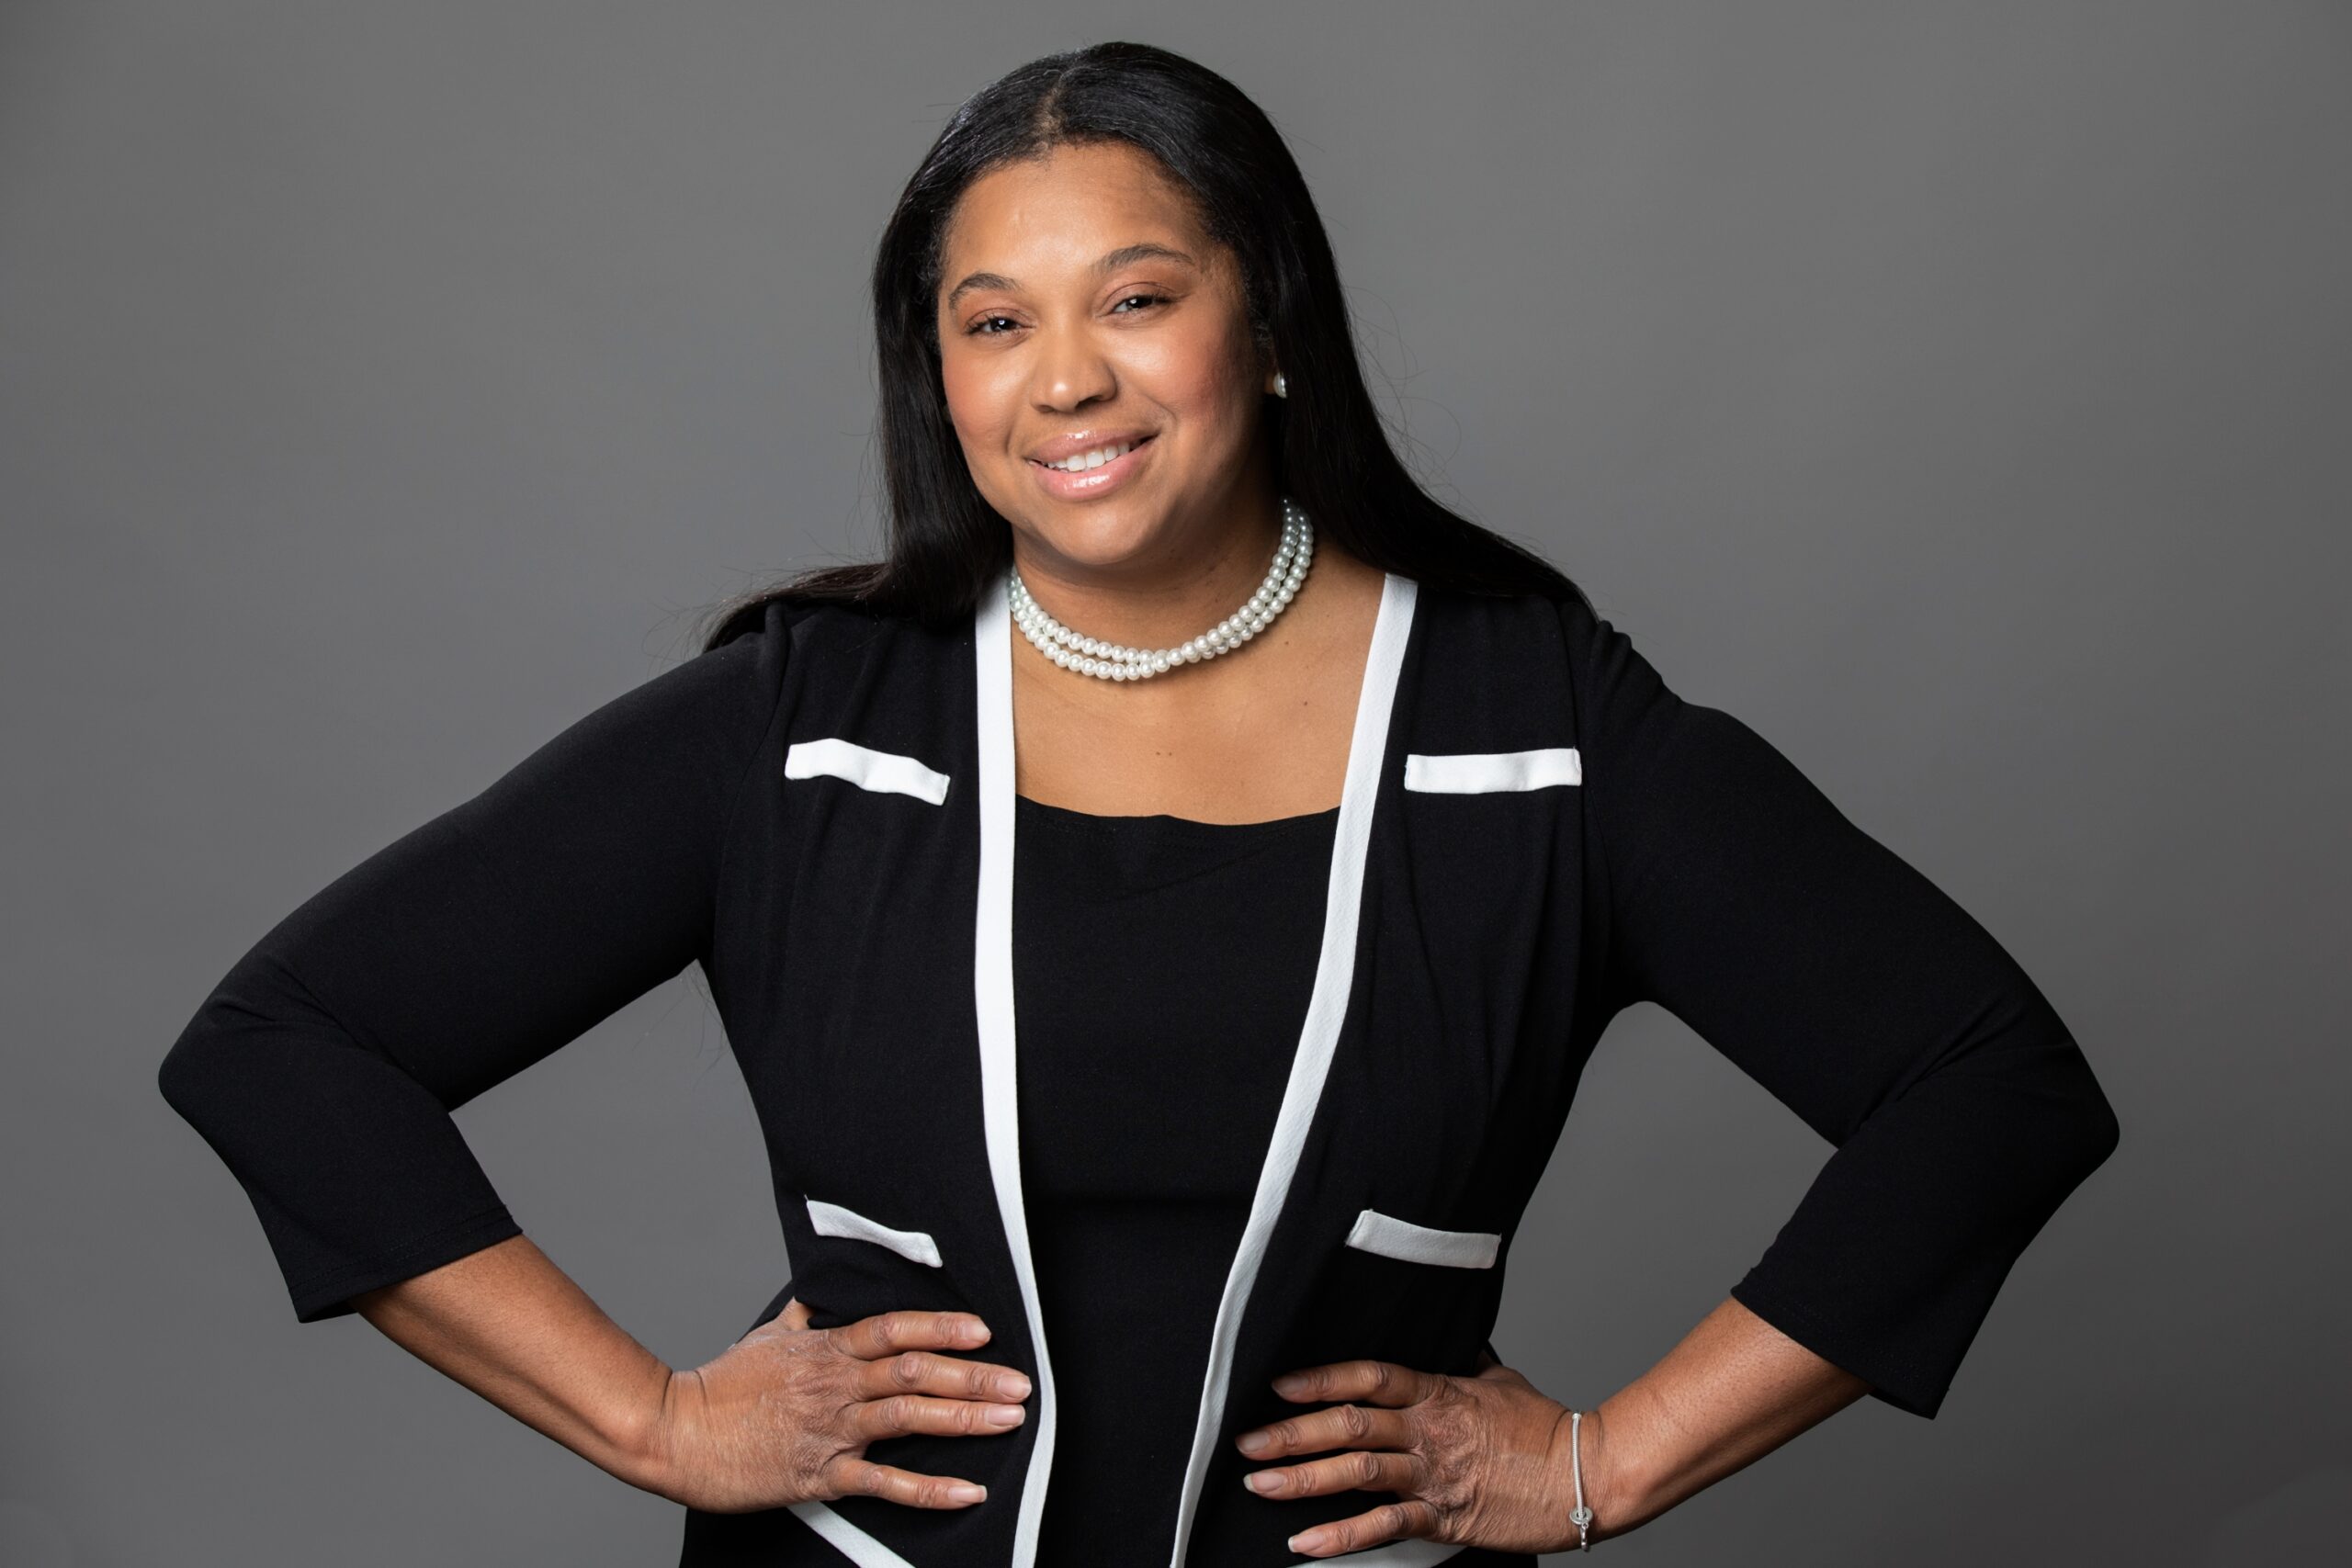
“Our goal is to provide a roadmap, skills, and community to foster Black media ownership in Syracuse.” Daniela Molta

What You Can Do

Give input and get involved.

Whether you’re an experienced volunteer, an activist, a student, working professional, or a stay-at-home parent, there are roles both big and small that you can play to shape the future of the region.

See Additional Opportunities View All
Volunteer
Join the Urban Jobs Task Force as a committee member Learn More »
Donate
Support workplace & economic development through Jubilee Homes of Syracuse Learn More »
Take Action
Join a community action group Learn More »
Civic Engagement
Join a board Learn More »